Exceptionally Wet Start to 2025 in Kentucky
Exceptionally Wet Start to 2025 in Kentucky
Meteorological spring officially came to a close at the end of May—and what a wet season it was! Following the second-wettest April on record, May continued the trend with consistent rainfall across the state. The official statewide average came in at 6.75 inches, which is 1.66 inches above normal, tying it for the 14th wettest May on the 131-year record.
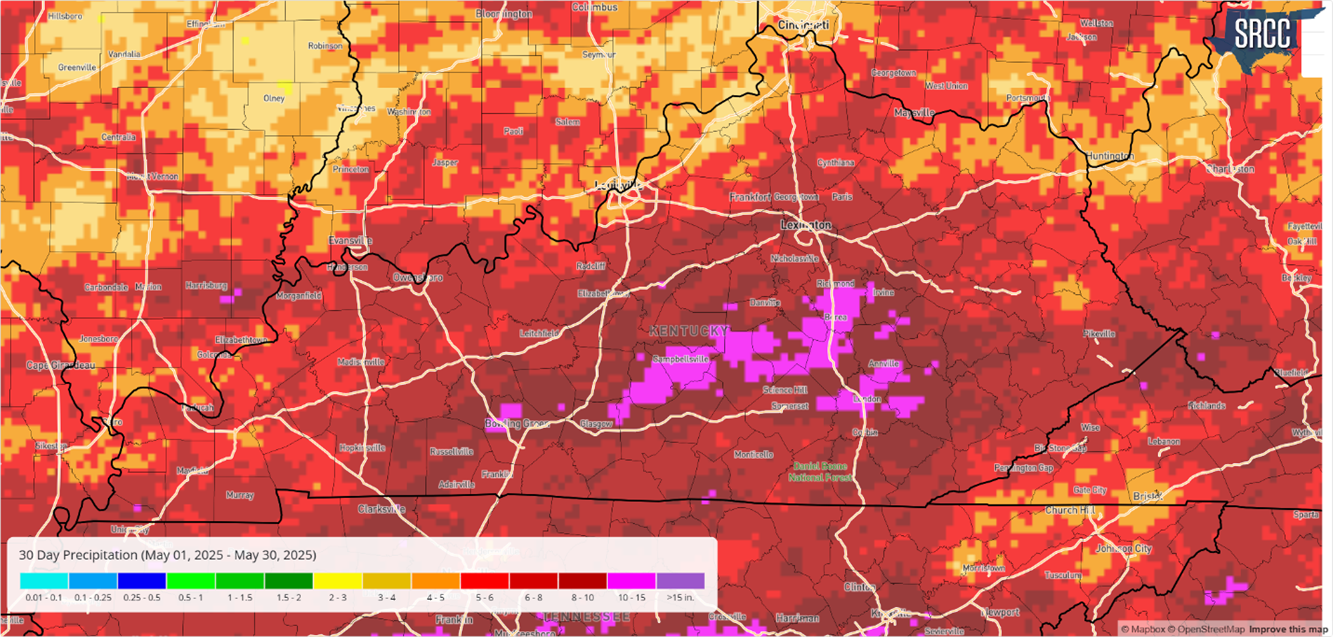
As shown in the map below, the heaviest rainfall totals were concentrated south of the Parkways, particularly across Central Kentucky. Some locations recorded over 10 inches of rain. The highest totals in our database came from the Campbellsville, Liberty, and McKee Mesonet stations, which reported 10.30, 10.32, and 10.30 inches, respectively.
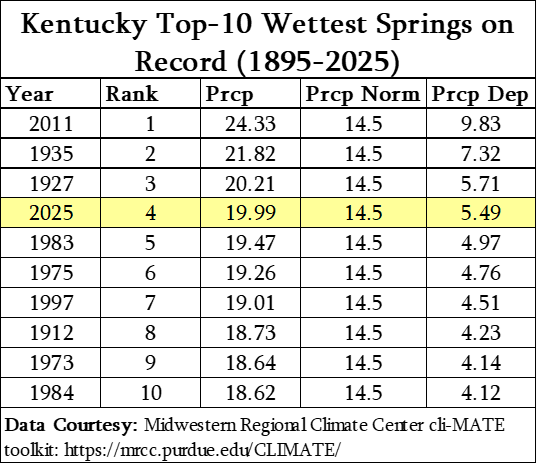
When combining March, April, and May, Kentucky averaged 19.99 inches of precipitation for meteorological spring—nearly 5.5 inches above normal—ranking as the 4th wettest spring on record (chart provided). I know spring planting has been a challenge for many this year, but honestly, I’d rather deal with a bit too much rain than face drought conditions!
But it gets even more impressive: extending the data back to January 1st, 2025 now ranks as the wettest January–May period on record in Kentucky. Over those five months, the state has averaged 31.51 inches of precipitation, which is a remarkable 9.41 inches above normal.
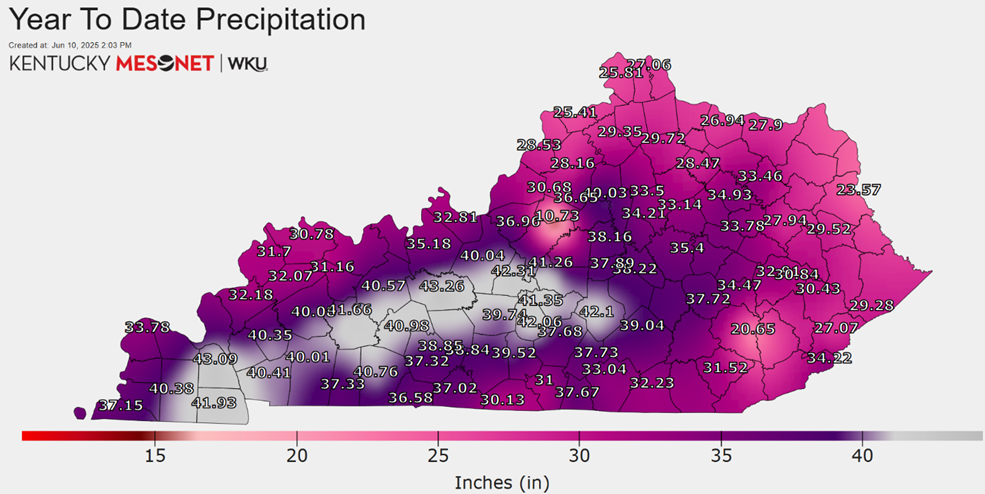
Looking at the year-to-date precipitation data from the Kentucky Mesonet (map below), many stations across the Pennyrile and Central Kentucky regions have already surpassed 40 inches. Grayson County leads the way with 43.26 inches. To put that in perspective, Kentucky’s annual average is 50.36 inches—and we still have seven months to go. Bottom line: it’s been an exceptionally wet start to the year.
Will it continue? Forecasts and outlooks suggest that it will—along with the eventual return of summer heat (May’s state average temperature was 1.1°F below normal, which has caused heat unit accumulations to fall behind schedule since May 1).
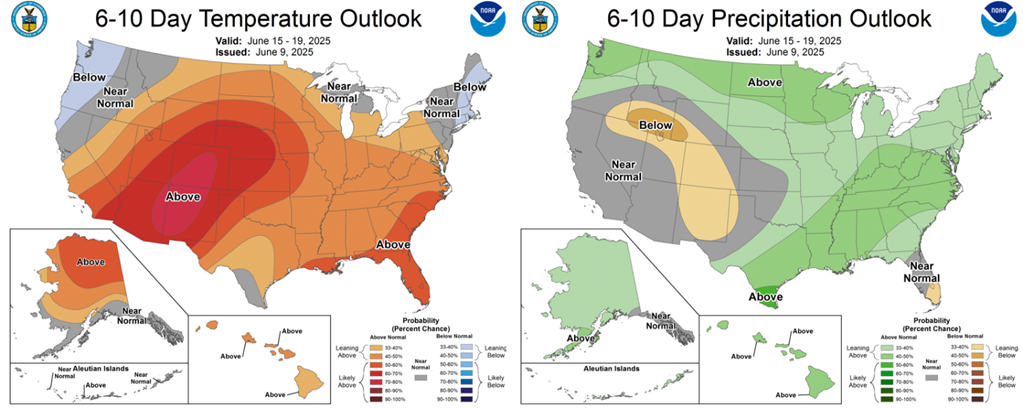
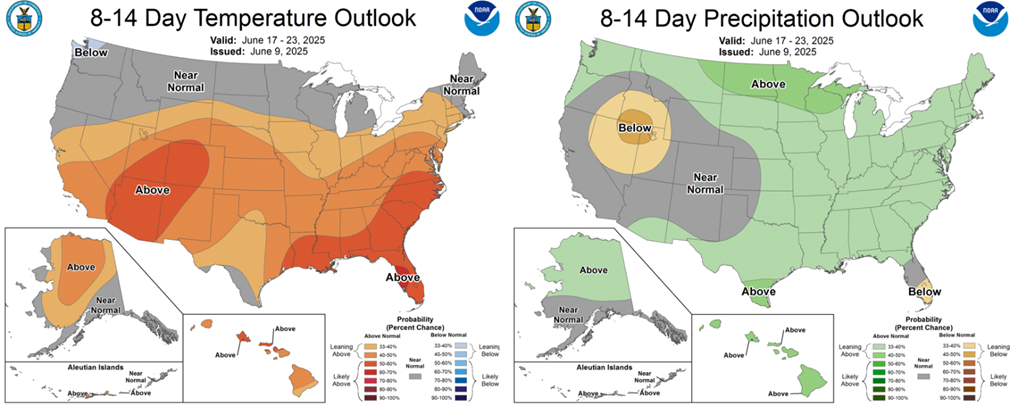
Below are the 6–10 day and 8–14 day outlooks, both of which lean toward above-normal temperatures and rainfall during those periods. Keep in mind: the darker the shading on the maps, the higher the confidence in the forecast. To put things in perspective, average highs this time of year typically range from the mid to upper 80s, while average lows fall in the low to mid 60s.
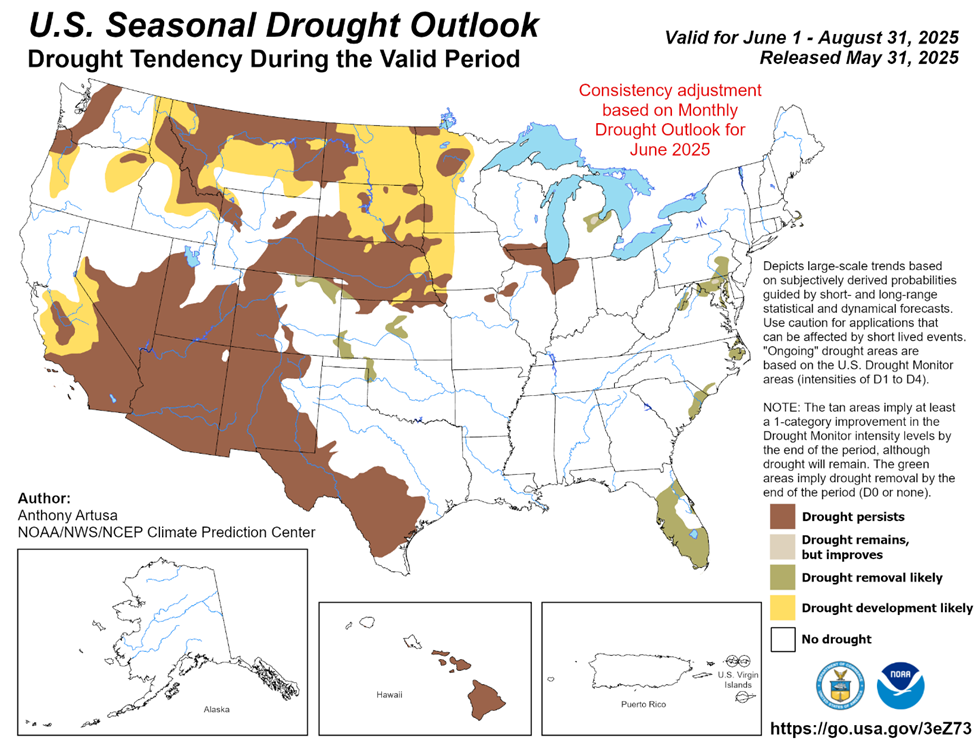
These outlooks are updated daily and can be viewed at the following link. Here, you can also find the monthly and seasonal outlooks. The summer outlook (June-August) is a little more indifferent when it come to precipitation, but saying that, the Climate Prediction Center just released their latest seasonal drought outlook (map below), which favors much of the Ohio Valley remaining drought free through the summer months. Thanks to our wet spring, soil moisture and streamflows are in relatively good shape as we head into the heart of summer. Here’s to hoping it stays that way!
Citation: Dixon, M., 2025. Exceptionally Wet Start to 2025 in Kentucky. Kentucky Field Crops News, Vol 1, Issue 6. University of Kentucky, June 13, 2025.